 Image: NOAA/NCDCAn earlier post, Welcome to the Preview, looked at the recent heat wave and the "hot spots" of predicted sea level rise in the U.S.
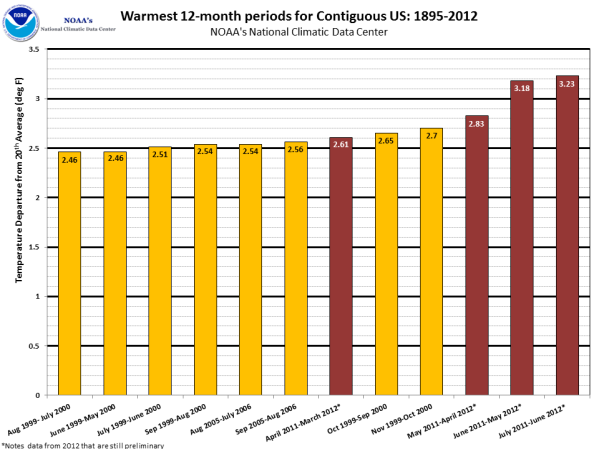
Now, in the June 2012 “State of the Climate Global Analysis” by The National Oceanic and Atmospheric Administration (NOAA), we get another Preview of the future. Each bar represents a 12-month period. The red bars are 4 of the warmest 12-month periods since record keeping began in 1895. And all 4 have occurred since April 2011.
Dr. Jeff Masters looked at the 13-month period just completed and writes:
U.S. heat over the past 13 months: a one in 1.6 million event
Each of the 13 months from June 2011 through June 2012 ranked among the warmest third of their historical distribution for the first time in the 1895 - present record. According to NCDC, the odds of this occurring randomly during any particular month are 1 in 1,594,323. Thus, we should only see one more 13-month period so warm between now and 124,652 AD--assuming the climate is staying the same as it did during the past 118 years. (emphasis added)
Welcome to The Preview.